We're building the future of agentic promotions. Sign up for early access!
Sign up
We're building the future of agentic promotions. Sign up for early access!
Sign up 
If you’re running an ecommerce brand, you’ve probably heard “customer acquisition cost” in every marketing review. But knowing your CAC and actually using it to make smarter decisions? That’s where most brands fall short.
Paid acquisition has gotten structurally more expensive, and iOS 14 having permanently reshaped how paid ads perform means that trend isn’t reversing for brands that haven’t adapted their strategy. The brands that still treat CAC as a single number to watch, rather than a formula to interrogate, are the ones overpaying the most.
In this guide, you’ll learn exactly what customer acquisition cost is, how to calculate it with the right formula, what a “good” CAC looks like for your specific ecommerce vertical, and the structural moves that lower it over time.
Customer acquisition cost is the total amount your business spends to acquire a single new paying customer within a given time period. It accounts for every sales and marketing dollar that went into bringing that customer through the door: paid ads, influencer fees, salaries, tools, and more.
Unlike vanity metrics like impressions or click-through rates, CAC ties directly to profitability and sustainability. If it costs you $150 to acquire a customer who only ever spends $80, your model isn’t working. If that same customer spends $800 over their lifetime, your model might be brilliant. The metric on its own doesn’t tell the whole story, but it’s the starting point for understanding your unit economics.
That’s the essence of what CAC means in marketing: it’s your investment-per-customer, measured in real dollars. As a quick definition, it’s the total cost incurred to convince a new customer to buy your product or service for the first time. It’s also one of the most closely watched numbers in DTC and ecommerce right now, and for good reason.
The most common way to calculate customer acquisition cost is straightforward:
CAC = Total Sales & Marketing Spend / Number of New Customers Acquired
Here’s a concrete ecommerce example. Say you’re a DTC skincare brand running paid acquisition:
CAC = $40,000 / 500 = $80 per customer
One thing to set before you run any CAC calculation: define your time period. Monthly, quarterly, annually: pick one and stay consistent so you’re comparing apples to apples across reporting periods.
The simple formula gets you started, but it often understates your true acquisition costs. Fully-loaded CAC adds all the costs that contribute to acquisition but don’t always show up in a paid media budget:
Taking the same skincare example and adding $5,000 in creative production, $3,000 in software, and $2,000 in agency fees brings the total to $50,000.
Fully-loaded CAC = $50,000 / 500 = $100 per customer
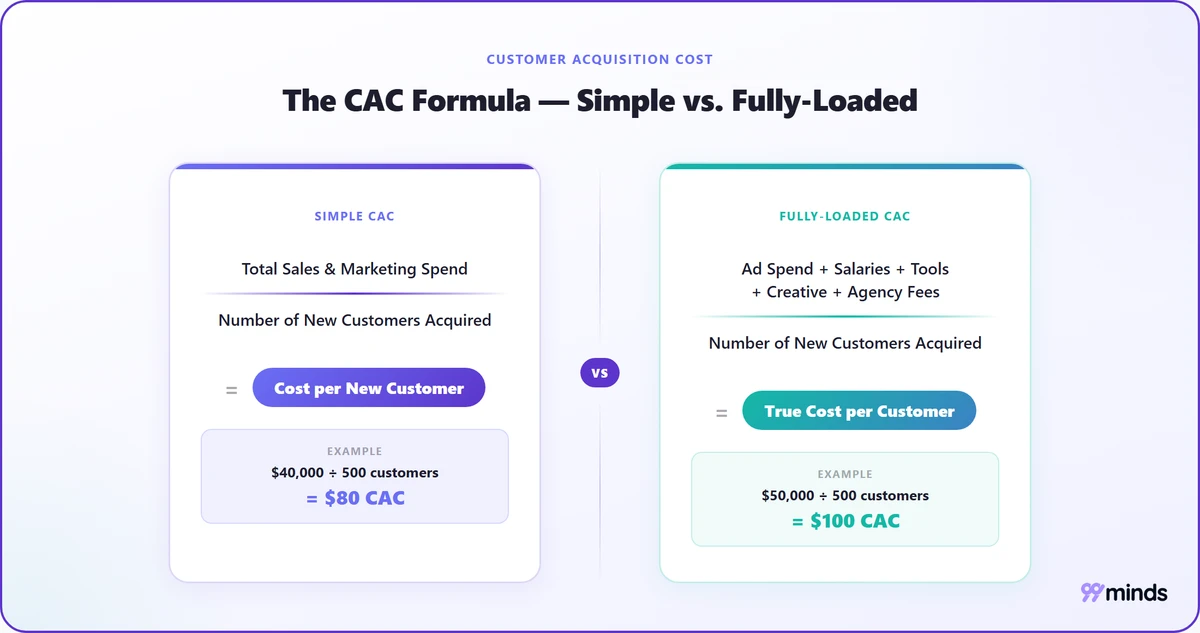
The gap between $80 and $100 matters significantly when you’re benchmarking against industry figures or presenting to investors. Always know which version you’re quoting, and label it clearly in any stakeholder report.
This distinction is missing from most customer acquisition cost guides online, and it’s one of the most important nuances for ecommerce brands managing both acquisition and re-engagement spend.
Blended CAC divides your total marketing spend by all customers acquired in a period, including people re-acquired through retargeting, win-back emails, or lapsed-customer campaigns.
New-customer CAC divides your acquisition-focused spend by first-time buyers only.
Why does this matter? If you’re running heavy retargeting campaigns, your blended CAC can look elevated even when your true new-customer acquisition efficiency is excellent. Conflating the two leads to flawed budget decisions: you might cut acquisition spend that’s actually performing well, or keep pouring money into re-engagement that isn’t closing the gap.
Best practice: track both. Optimize primarily on new-customer CAC to measure true acquisition efficiency. Use blended CAC to assess your overall marketing ROI and see how owned channels are shifting the overall cost picture.
Getting your CAC calculation right depends on knowing what goes in the numerator and what doesn’t. Here’s a clear breakdown:
Include in your CAC:
Exclude from your CAC:
These last four are retention or operational expenses. They don’t belong in the acquisition bucket.
One common mistake worth calling out specifically: folding loyalty reward costs or re-engagement email spend into your acquisition calculations. Those are retention costs. Including them inflates your CAC, distorts your benchmarking against industry figures, and makes it much harder to identify what’s actually driving new customer growth versus what’s keeping existing customers engaged.
There’s no single “good” CAC that applies to every brand. What looks expensive in one vertical is perfectly reasonable in another, depending on average order value, purchase frequency, and customer lifetime value. This is the benchmark data most CAC guides don’t provide because most of them are written with a SaaS or enterprise lens.
Here are typical CAC ranges by vertical, drawn from ecommerce industry averages:
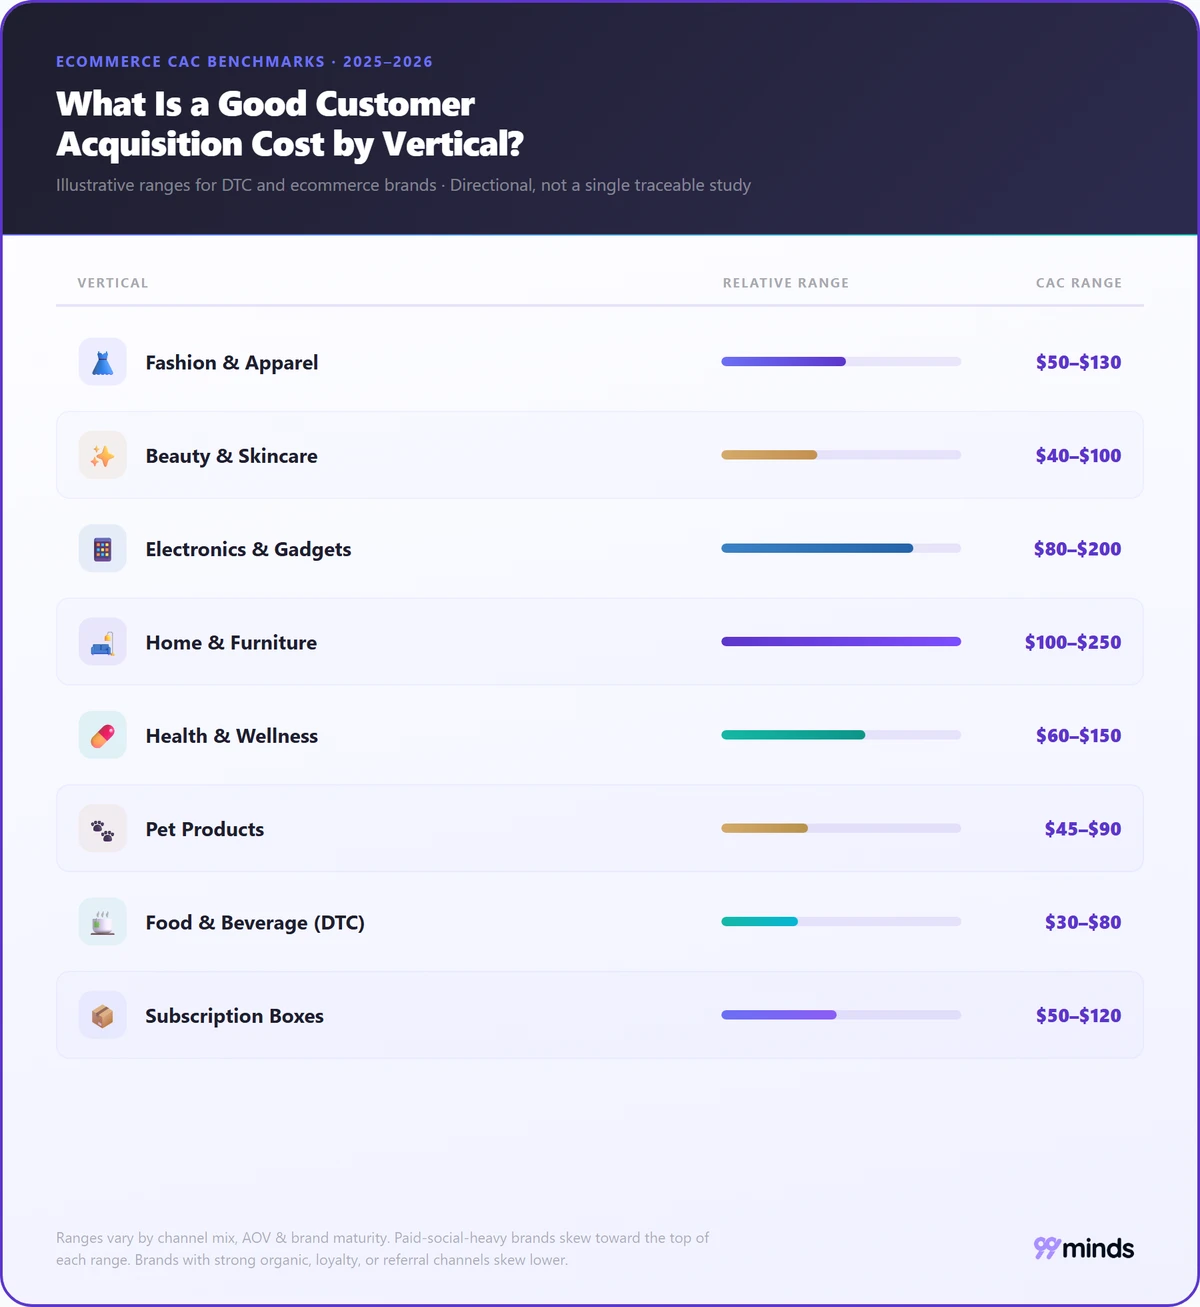
(Illustrative ranges, not a single traceable study. Actual benchmarks vary widely by sub-sector, region, and business model, so use these as a directional starting point rather than a target.)
Important caveat: these ranges shift significantly based on your channel mix, average order value, and brand maturity. Brands running heavy paid social acquisition will typically land near the top of their vertical’s range. Brands with strong organic, referral, or loyalty-driven channels will skew toward the bottom.
Use these figures as reference points, not hard targets. Your unit economics, specifically your LTV:CAC ratio and payback period, matter more than any industry average.
The most useful benchmark isn’t your raw CAC in isolation. It’s the relationship between your customer lifetime value and your CAC:
LTV:CAC = Customer Lifetime Value / Customer Acquisition Cost
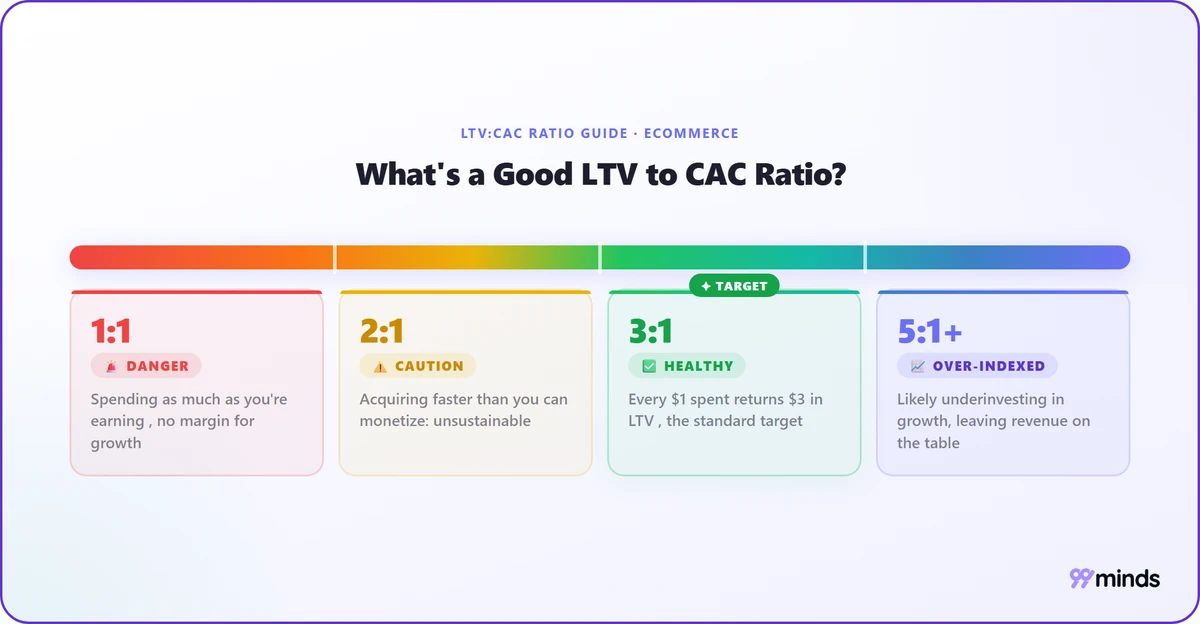
Here’s how to interpret that ratio for ecommerce:
A high CAC paired with a very high LTV can be an excellent unit economics profile. A low CAC paired with poor LTV is actually a more serious problem. Always contextualize your acquisition cost within the full customer value picture.
The CAC payback period tells you how many months it takes to recoup what you spent acquiring a customer through the revenue they generate:
CAC Payback Period = CAC / (Average Monthly Revenue Per Customer x Gross Margin %)
Example: CAC of $80, average monthly revenue of $20 per customer, gross margin of 60%.
$80 / ($20 x 0.60) = 6.7 months payback
Benchmarks to know: under 12 months is the target for most ecommerce brands. Under six months is excellent. Over 18 months is a red flag, particularly for brands funding paid acquisition on credit and sitting cash-negative per customer for that entire window.
If your customer acquisition costs feel meaningfully higher today than they did a few years ago, they almost certainly are. ProfitWell’s analysis of subscription businesses found CAC had already risen roughly 60% in the five years before 2020, and the pressure on ecommerce brands specifically has compounded since, driven in large part by one event.
What changed with iOS 14.5: In April 2021, Apple launched its App Tracking Transparency (ATT) update. It required apps to ask users for explicit permission before tracking their behavior across other apps and websites. According to Flurry Analytics, the opt-in rate among apps that displayed the prompt hovered around one-quarter of users. That meant roughly three-quarters of iOS users became invisible to Meta’s ad targeting and campaign optimization engine essentially overnight.
The direct impact on paid CAC: Meta’s algorithm lost the conversion signal it needed to optimize campaigns effectively. CPMs rose across the board. Return on ad spend dropped. And paid customer acquisition costs climbed sharply for ecommerce brands that depended on Facebook and Instagram as their primary acquisition channels.
The next wave: Google’s evolving approach to third-party cookie deprecation, now rolling out across Chrome, extends this signal loss into search and display advertising. The trend of rising paid acquisition costs isn’t a temporary dip. It reflects a structural shift in how digital advertising works.
The structural response that worked: Brands that had invested in owned channels before these changes, including email lists, retention marketing programs, referral networks, and SMS, were largely insulated. Their blended CAC stayed lower because a growing share of their customers arrived through channels with near-zero per-customer acquisition cost.
This is why loyalty and referral programs have shifted from nice-to-have to CAC-critical infrastructure for serious ecommerce brands. Which brings us to the most mathematically powerful way to lower your blended CAC over time.
Loyalty and referral programs aren’t just customer-experience initiatives. They’re structural CAC deflators that change your unit economics at the foundation level. Here’s the math that makes that case.
Take a typical example: a referred customer might cost $15 in referral rewards to acquire, compared to $100 in paid media for the same customer type. That’s roughly a 6x cost difference on a per-acquisition basis, and the advantages compound from there.
Referred customers tend to carry meaningfully higher lifetime value than customers acquired through other channels, and they convert faster than cold paid traffic. You’re paying less to acquire a more valuable customer. The unit economics improve on both ends simultaneously.
The blended-CAC math is what really moves the needle for brand growth. If 20% of your new customers come through referral marketing at a $15 CAC and the other 80% come through paid channels at a $100 CAC, your blended CAC drops from $100 to $83 without touching your ad budget or reducing spend.
As your referral program scales and referral share grows from 20% to 30% to 40%, blended CAC keeps falling, even if your paid CAC stays completely flat.
The 99minds Referral Program automates tracking, rewards issuance, and program scaling so the referral flywheel runs without manual effort and compounds over time.
The first acquisition is always your most expensive. The second purchase from an active loyalty member costs a fraction of that: typically just the operational cost of the email or push notification that triggers it.
As your loyalty base grows, it actively dilutes your blended CAC. More returning customers acquired at near-zero cost means each new paid acquisition needs to carry less of the total cost burden.
Here’s a concrete example. Say you have 1,000 customers in a given period: 200 returning via your 99minds loyalty program at roughly $2 CAC each, and 800 acquired via paid ads at $100 CAC each.
Blended CAC = (($2 x 200) + ($100 x 800)) / 1,000 = $80.40
Compare that to a fully paid mix: $100 blended CAC. Your loyalty program just reduced blended CAC by nearly 20%, structurally, without cutting a single ad.
For 12 actionable strategies to bring your CAC down further, see the full guide to reducing customer acquisition cost.
Here’s a structurally underused CAC tool, especially for DTC brands dealing with high return volumes in fashion and electronics.
When a customer returns an item and receives 99minds store credit instead of a cash refund, that revenue stays in the business. The customer’s next purchase doesn’t require any paid re-acquisition cost. You’ve turned a potential churn event into a near-zero-CAC repeat purchase, which lowers your blended CAC and keeps cash in the business at the same time.
Knowing your CAC and benchmarking it is step one. Acting on it is step two, and that’s a full playbook of its own: funnel optimization, owned-channel growth, referral and loyalty mechanics, creative testing, and SEO all play a role, each with different payback timelines.
Rather than compress that into a few bullets here, see the complete breakdown in our guide to 12 proven ways to reduce customer acquisition cost for DTC brands, which walks through each tactic in depth.
Customer acquisition cost isn’t just a marketing metric. It’s a measure of whether your business model is financially sustainable at its current scale and channel mix.
For ecommerce and DTC brands, three habits separate teams that manage CAC effectively from those that don’t: benchmarking against their own vertical (not SaaS or generic averages), tracking LTV:CAC ratio with a 3:1 target in mind, and understanding what’s actually driving their CAC at the channel level rather than treating it as a single blended number.
In the post-iOS 14 environment, the brands winning on CAC are the ones investing in owned channels: loyalty programs, referrals, and email, not just optimizing their paid campaigns. The most durable way to lower blended CAC isn’t to spend less on acquisition. It’s to build the systems that make your existing customers bring in new ones.
Ready to build the loyalty and referral programs that structurally lower your blended CAC? 99minds helps ecommerce brands on Shopify and BigCommerce automate loyalty, referrals, and store credit, so every customer you acquire helps bring in the next one. Start free.